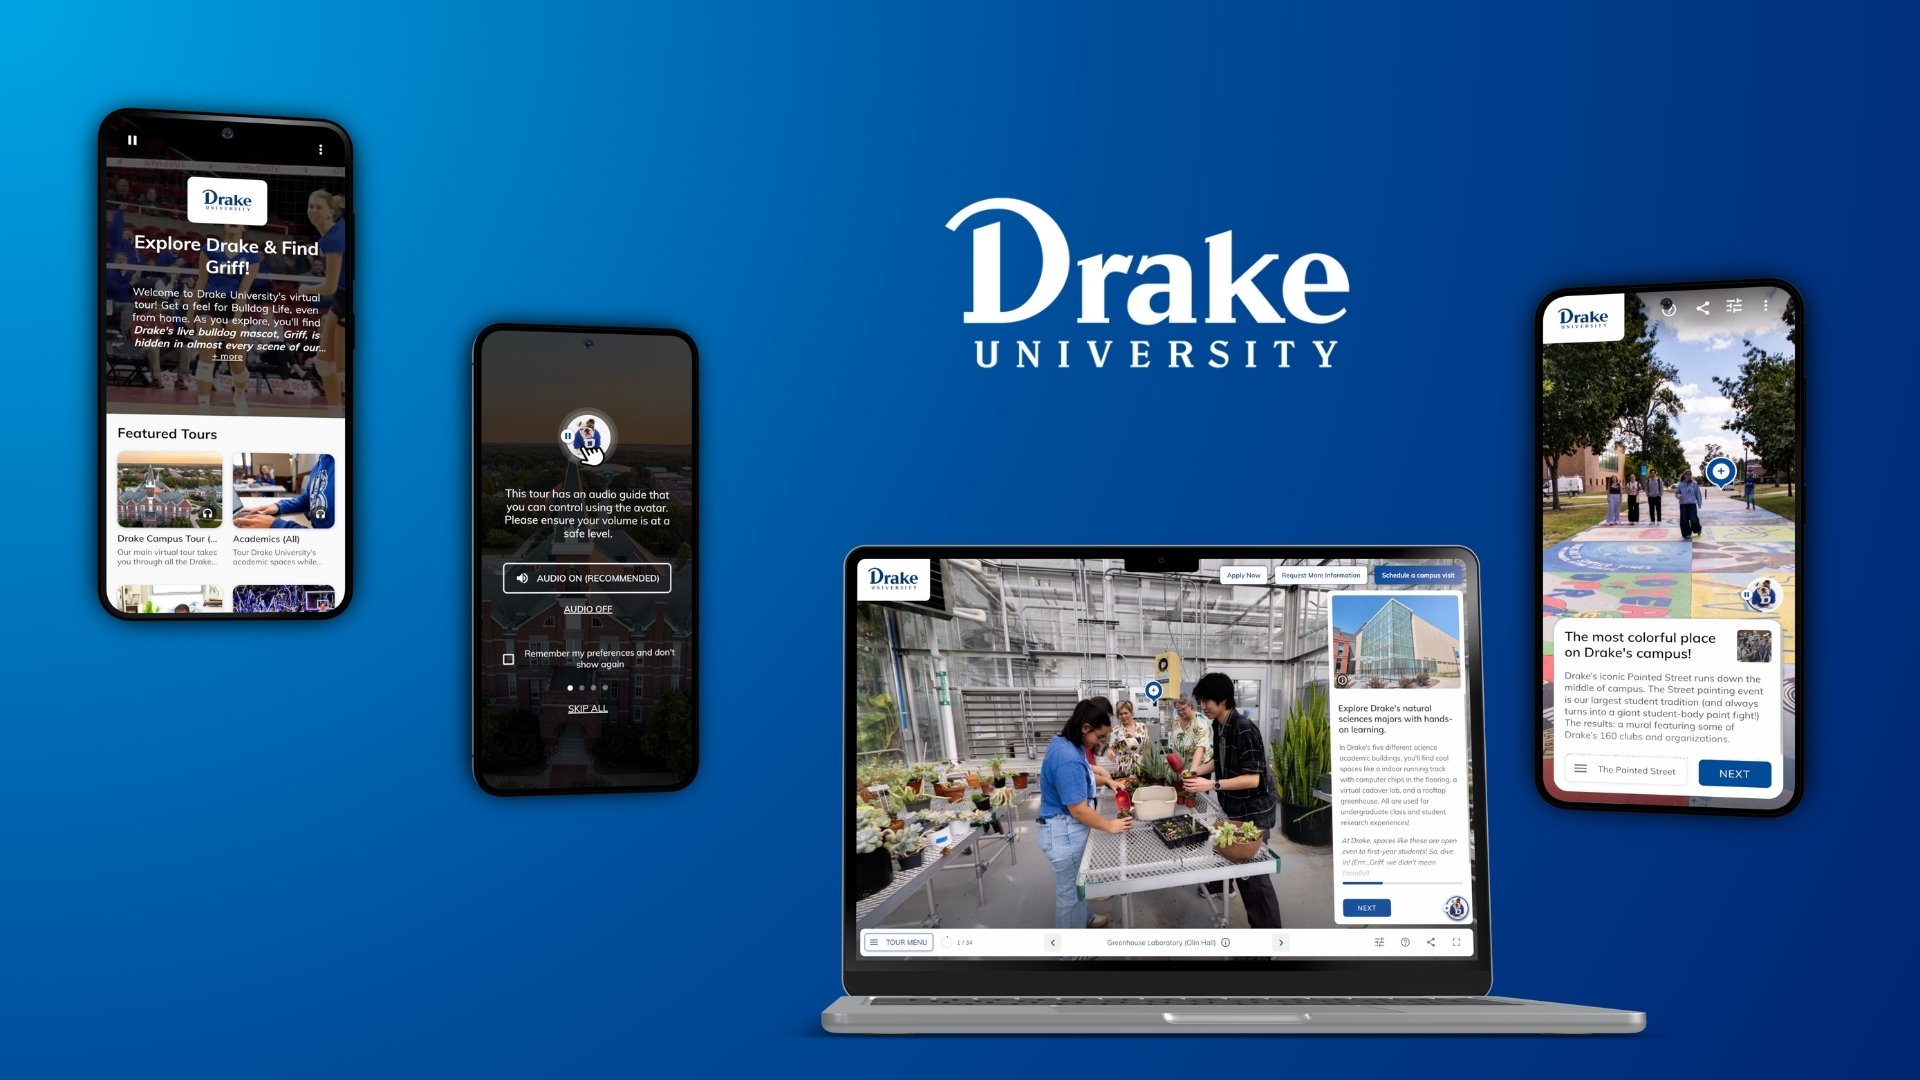
Whether you are a numbers person or not, analytics are a crucial tool for evaluating your digital presence and making informed decisions. This concept holds true for your virtual tour. Put simply, measuring your analytics is the process of collecting data, analyzing it, and using it to inform decisions and strategies that help you increase your return on investment (ROI).
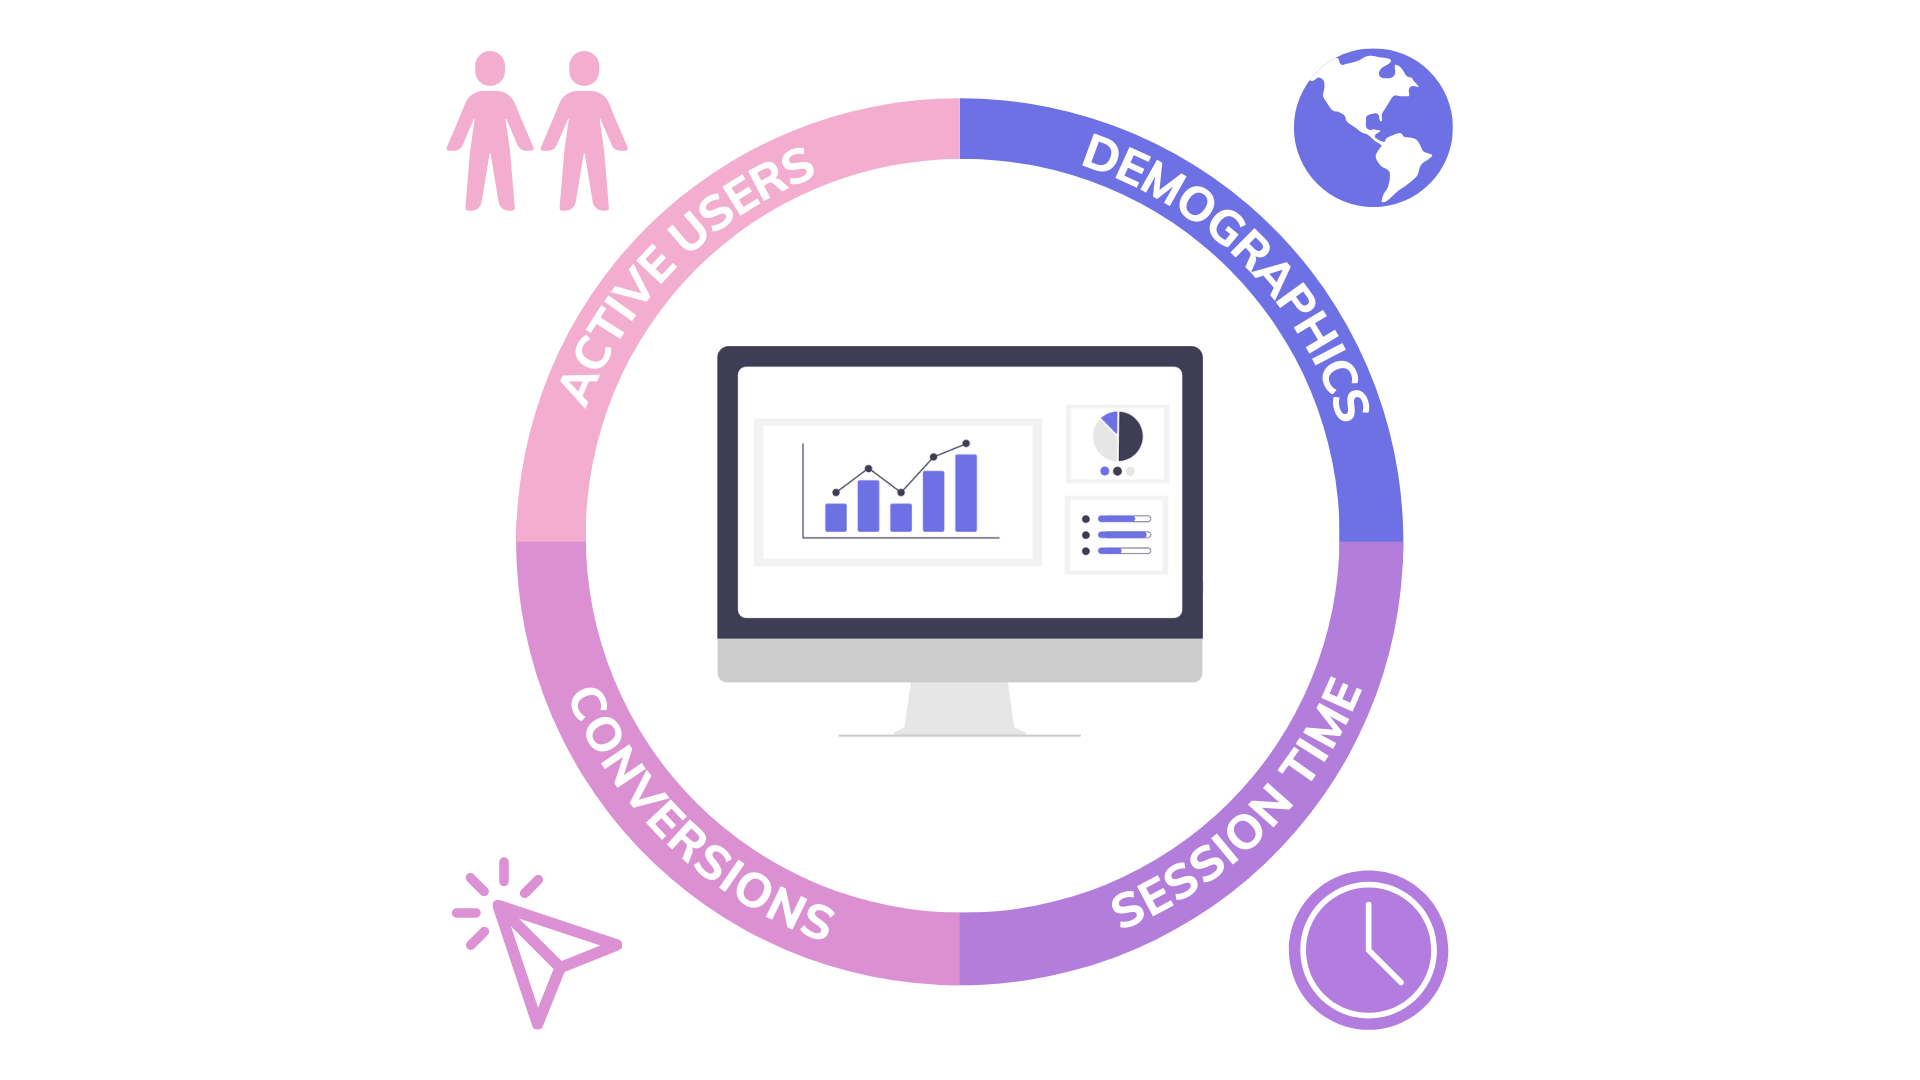
There are countless ways to measure the success of your virtual tour analytics. If you are not too familiar or want to take a closer look at your project performance, here are our top recommendations of metrics to keep an eye on:
- Active users and bounce rate
- Session time and average pages per session
- User demographics
- Conversion performance
Below are some details and best practices for evaluating these analytics.
Active users and bounce rate tracks the exposure of your virtual tour
Companies tell stories and capture spaces that get people excited about what they have to offer. Virtual tours are proven tools to help you gain brand awareness. Some customers share their tour on various web pages or third-party sites to get more eyes on their company. Measurements for this type of goal may include numbers of users, sessions or bounce rate. These analytics will show you how many people are visiting your tour, how many times they are returning and whether they are engaging with content or leaving after a single page. If you’re not seeing the results you want, you can brainstorm innovative ways to market your tour to reach more people.
Active monthly users vary from organization to organization, and are influenced by factors like typical volume of traffic to your website, campaign activity, SEO, and many others. For these reasons, it’s difficult to benchmark what your virtual tour traffic should be. The best thing to do is plan to evaluate on an ongoing basis after launch, and strive to increase the traffic to your virtual tour over time.
From our experience, bounce rates of 10 to 20 per cent are best-in-class, meaning 9 out of 10 users are interacting with the site after entering. The common range is 20 to 30 per cent, which is still strong. If you’re seeing rates over 30 per cent, you should take a closer look at your tour homepage or main entry points into the tour. For comparison, look at the bounce rate of your company's home page, landing pages, or other microsites.
If you’re concerned about your bounce rate, dig deeper to see which channels have the highest bounce and consider changing marketing messaging to align better with the content on your tour. If users are being served ads that don't directly correlate with what they are seeing when they open your tour, they are more likely to leave immediately. Make sure you are reflecting the true value of your virtual tour to end-users in your marketing so they know what to expect when they click into the site.
Average session time and average pages per session tracks how well you are engaging visitors
Highlighting stories and behind-the-scenes details encourages your prospects to further engage with your content. To track how well your tour is engaging users, you’ll want to focus on user behaviour. It’s helpful to look at time spent on tours and the number of scenes a user visits during their session. Keep an eye on your most popular pages too! With these metrics, you’ll find out what end users are interested in and what is performing best. If you need to make changes, you can try rewriting lower performing content to match content on popular pages or spacing hot pages out to keep people clicking through your tour longer.
Average session times are influenced by the content in your tour, as well as tour embeds on third party sites or webpages. For organic visitors, a good starting point is to aim for a minimum five minute session time.
Pages per session should be evaluated relative to the size of your tours. For example, a tour with 20 scenes could result in an average of 10 pages per session. As average pages per session nears the number of scenes in a tour, it’s likely your users would consume more content if it was available to them. If this is the case, consider adding more scenes to increase engagement. Another useful way to track completion rates is to segment analytics by users who have a “Finished Tour” event.
User demographics tracks whether you are hitting certain age groups or locations
Maybe you want to hit a certain demographic or are specifically trying to use your virtual tour to help with international engagement. Demographic analytics show if you're reaching the people you want. With this area of analytics, you can review where your visitors are coming from. You can also keep an eye on age groups of people visiting to see if your customer profiles are correct. These analytics help you understand your audience and may lead you to do some thinking about how you’re talking to them.
User demographics vary from customer to customer and depend on your target audiences. By examining user data, you assess if your key markets are being represented. For instance, if you are trying to communicate with an audience in India but your demographics don’t show a large number of visits from users located there, you may be underpromoting in that market. These metrics can also signal additional developments for your tour. If you notice big numbers coming from certain countries, you can consider incorporating another language into your tour to better communicate with users from that area.
You may discover additional audiences that you hadn’t initially been targeting. Age data may show you that there are more mature audiences checking out your virtual tour. If you are a post-secondary institution, this could mean that parents are helping their children with research or perhaps you have a substantial mature student audience. Informing your customer personas with user analytics can help you optimize the experience for the people who use it most.
Conversion metrics track the effectiveness of the virtual tour in converting leads to customers
Many teams are interested in using their tours to support conversion. This could mean anything from providing an email, booking a spot for an event or even making a purchase from your company. Keep a close eye on form submissions and click-through rates to see how people are interacting with your CTAs. After reviewing the data, you may decide to change up wording on CTAs or make them more prominent to increase submissions.
Successful numbers for conversion analytics will vary based on your audience and the nature of your goals. If you are looking to track conversion from your tour, you can compare events to form submissions to see if your customers are converting. Put simpler, track the details of who is clicking on buttons versus submitting their information to you.
If you are not seeing the anticipated numbers for conversion, you may want to consider the wording on your CTAs to see if it is resonating with your customers. Does the CTA make sense as a next step based on what the prospect is doing? You should also look at the length of your form. People like quick and easy actions. Make it as easy as possible to have people opt-in – you can always follow up later if you need more details from the audience.
Additionally, you may want to consider a pop-up form at specific points throughout the tour. Pinpoint a number of scenes in your tour that show users are engaged. Then, incorporate a pop-up to offer them the chance to submit their information. If they are making it far enough into your tour, they are interested in what you have to offer and may be more likely to want to connect with you.
Take data even further using virtual tour analytics in conjunction with your local customer relationship management (CRM) tool. A direct integration to your CRM allows you to continue the conversation with your leads. Generate campaigns based on actions they take and track the conversion of your customers based on the interactions they had with you – including completing a tour. Watch prospects make their way through the funnel on your CRM. Try including different tour checkpoints in your communication campaigns to personalize the experience. By measuring their actions after interacting with a tour, you can find out how it benefits your leads and make changes to improve the experience if necessary.
Putting it all together: building a scorecard
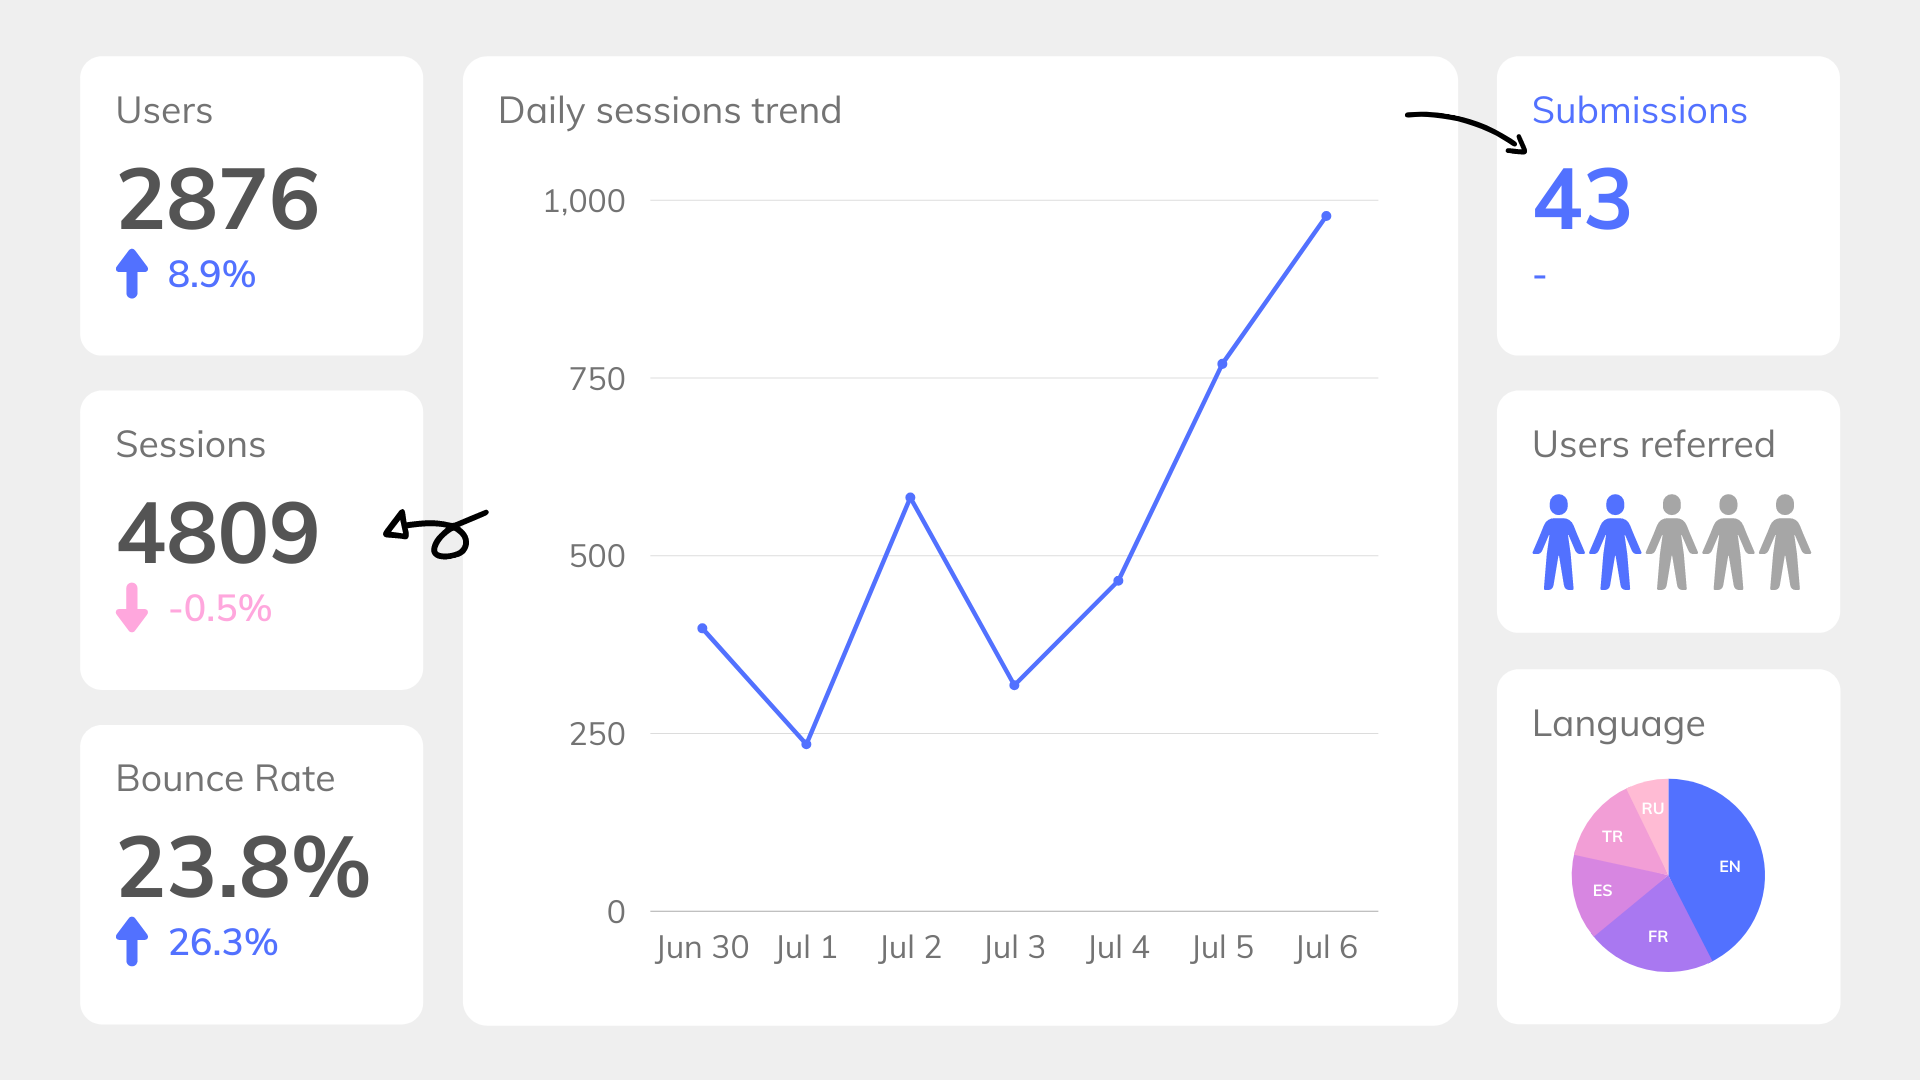
After launching your virtual tour, you can use a scorecard of key metrics to track performance over time, and make changes as needed to ensure your tour is fully supporting end users. As the data set builds up, a clearer picture will emerge as trends are established. This is the gold that you can mine when making future expansion decisions. With Circuit, you get a weekly report on your analytics with a high level overview of your virtual tour’s performance. You can also review Google Analytics in-depth for more detailed user behaviour queries. By regularly analyzing your numbers, you can continue to optimize the experience to achieve your goals.
Want to take a look at what a Circuit dashboard looks like? Click here to book some time with us.